The traditional path to a college degree isn't for everyone. Many individuals find themselves seeking education and personal development opportunities outside the confines of a formal degree program. Non-degree college courses have become increasingly popular for those who want to acquire new skills, explore their interests, and enhance their professional prospects without committing to a full degree. In this article, we will explore the world of non-degree college courses, shedding light on their benefits, types, and how to make the most of them. What Are Non-Degree College Courses? Non-degree college courses, often referred to as continuing education or adult education, encompass a wide array of learning opportunities offered by colleges and universities. These courses do not lead to a degree but instead provide a more flexible, accessible, and targeted approach to learning. Non-degree courses are designed for individuals of all backgrounds and ages who wish to gain specific know...
Chapter 4 covers graphing linear equations which is a fundamental skill in algebra and mathematics. Linear equations describe relationships between two variables, often represented as straight lines on a graph. To graph a linear equation, you typically need to follow these steps:
Write the equation in slope-intercept form: The slope-intercept form of a linear equation is y = mx + b, where:
y is the dependent variable (usually on the vertical axis).
x is the independent variable (usually on the horizontal axis).
m is the slope of the line.
b is the y-intercept (the point where the line crosses the y-axis).
Identify the slope (m) and y-intercept (b): From the equation, determine the values of m and b.
Plot the y-intercept: Locate the point (0, b) on the graph. This is where the line crosses the y-axis.
Use the slope to find other points: The slope m indicates how much y changes for each unit change in x. To find another point on the line, start from the y-intercept and use the slope to move to the right (positive x) or left (negative x) and then up or down accordingly. For example, if the slope is 2/3, for every increase of 3 in x, you would increase 2 in y.
Connect the points: Once you have at least two points on the line, draw a straight line that passes through those points. This line represents the graph of the linear equation.
Label the axes and title: Don't forget to label the axes with their respective variables (e.g., x and y) and give your graph a title if necessary.
Here's an example:
Let's say you have the equation y = 2x + 1.
The slope (m) is 2, and the y-intercept (b) is 1.
Plot the y-intercept at (0, 1).
Use the slope: Move 2 units up and 1 unit to the right from the y-intercept point to get another point, say (1, 3).
Connect the two points (0, 1) and (1, 3) with a straight line.
Label the axes and title the graph as needed.
Remember that linear equations result in straight lines, so if you have a different linear equation, the process will be similar, but the slope and y-intercept values will be different, leading to a different line on the graph.
The Coordinate Plane:
The coordinate plane, also known as the Cartesian plane, is a two-dimensional system used to represent points, lines, and shapes in mathematics. It consists of two perpendicular number lines, typically referred to as the x-axis and the y-axis, which intersect at a point called the origin. This system allows us to precisely describe the location of points in two-dimensional space using pairs of coordinates.
Here are the key components and concepts related to the coordinate plane:
The Origin: The point where the x-axis and y-axis intersect is called the origin, typically denoted as (0, 0). It serves as the reference point for all other coordinates on the plane.
X-Axis: The horizontal number line is called the x-axis. It extends infinitely in both the positive (right) and negative (left) directions. Points on the x-axis have coordinates of the form (x, 0), where 'x' represents the distance from the origin along the x-axis.
Y-Axis: The vertical number line is called the y-axis. Similar to the x-axis, it extends infinitely in both the positive (upward) and negative (downward) directions. Points on the y-axis have coordinates of the form (0, y), where 'y' represents the distance from the origin along the y-axis.
Coordinates: Points on the coordinate plane are represented by pairs of numbers, (x, y), where 'x' is the horizontal position (along the x-axis) and 'y' is the vertical position (along the y-axis). These coordinates specify the exact location of the point in relation to the origin.
Quadrants: The coordinate plane is divided into four regions called quadrants, numbered counterclockwise from the top right as follows:
Quadrant I: Positive x and positive y values.
Quadrant II: Negative x and positive y values.
Quadrant III: Negative x and negative y values.
Quadrant IV: Positive x and negative y values.
Axes and Axes Labels: The x-axis and y-axis are labeled with their respective variables (x and y), and they have scales with evenly spaced tick marks for measurement.
Distance and Slope: The distance between two points on the coordinate plane can be calculated using the distance formula, and the slope of a line passing through two points can be determined using the slope formula.
The coordinate plane is a fundamental tool in various mathematical and scientific disciplines, such as geometry, algebra, calculus, and physics. It allows for precise representation and analysis of geometric shapes, equations, and relationships between variables in two-dimensional space.
Unit 4 Exercises 4.1:
In which quadrant does the point (5,5)
III
I
IV
II
The point (5, 5) lies in Quadrant I of the coordinate plane.
In Quadrant I:
Both the x-coordinate (horizontal) and the y-coordinate (vertical) are positive.
The x-axis is to the right (positive direction), and the y-axis is upward (positive direction).
So, since both coordinates of the point (5, 5) are positive, it falls within Quadrant I.
In which quadrant does the point (2,2) lie?
I
IV
III
II
Since both coordinates of the point (2,2) are positive it falls again within Quadrant I.
In which quadrant does the point (5,4) lie?
I
II
III
IV
The point (5, 4) lies in Quadrant I of the coordinate plane.
In Quadrant I:
Both the x-coordinate (horizontal) and the y-coordinate (vertical) are positive.
The x-axis is to the right (positive direction), and the y-axis is upward (positive direction).
Since both coordinates of the point (5, 4) are positive, it falls within Quadrant I.
Plot these points:
Plot these points:
| x | y |
|---|---|
| 5 | 4 |
| 7 | 7 |
| 8 | 1 |
| 2 | 5 |
| 4 | 2 |

To plot these points on a coordinate plane, you can use the given x and y values as coordinates. Here are the points plotted:
(5, 4)
(7, 7)
(8, 1)
(2, 5)
(4, 2)
If you look above you can see the proper plotting for each as blue dots.
Find the coordinates of the point plotted below
Coordinates: (,)
As you can see the red dot appears on the 4 line on the cross which is our x axis while the y being -2 tells us to go down -2 from the x axis.
Find the coordinates of the point plotted below
Coordinates: (,)
On this one the x axis is negative -2 on the straight line and we go up 3 on the y axis.
Find the coordinates of the point plotted below
Coordinates: (,)
The x axis is 2 and then y we move up 4.
Find the coordinates of the point plotted below
Coordinates: (,)
The x axis is 3 and then we go down -3 on the y.
Plot the point (3,-2)

To plot the point (3, -2) on a coordinate plane, follow these steps:
Locate the x-axis (the horizontal line) and the y-axis (the vertical line) on your graph paper or coordinate system.
Start at the origin, which is the point (0, 0), where the x-axis and y-axis intersect.
Move 3 units to the right along the x-axis because the x-coordinate is 3.
From the point you reached on the x-axis, move 2 units downward along the y-axis because the y-coordinate is -2.
Mark this point where the horizontal line (x-axis) and vertical line (y-axis) intersect after moving 3 units right and 2 units down.
Your point (3, -2) is plotted on the coordinate plane.
Plot the points (0,1),(-4,0),(5,-4),(-3,-5)

To plot the points (0, 1), (-4, 0), (5, -4), and (-3, -5) on a coordinate plane, follow these steps:
Locate the x-axis (horizontal) and the y-axis (vertical) on your graph paper or coordinate system.
Start at the origin, which is the point (0, 0), where the x-axis and y-axis intersect.
Plot each point based on its coordinates:
(0, 1): Move 0 units to the right along the x-axis (since x = 0) and then 1 unit upward along the y-axis (since y = 1). Mark the point (0, 1).
(-4, 0): Move 4 units to the left along the x-axis (since x = -4) and then 0 units along the y-axis (since y = 0). Mark the point (-4, 0).
(5, -4): Move 5 units to the right along the x-axis (since x = 5) and then 4 units downward along the y-axis (since y = -4). Mark the point (5, -4).
(-3, -5): Move 3 units to the left along the x-axis (since x = -3) and then 5 units downward along the y-axis (since y = -5). Mark the point (-3, -5).
Graphs of Linear Equations
Graphs of linear equations represent the relationship between two variables using straight lines on a coordinate plane (usually with an x-axis and a y-axis). Linear equations are equations that can be written in the form:
y=mx+b
y is the dependent variable (usually plotted on the vertical or y-axis).
x is the independent variable (usually plotted on the horizontal or x-axis).
m is the slope of the line.
b is the y-intercept (the point where the line crosses the y-axis).
Here's how to graph a linear equation:
Write the equation in slope-intercept form: Ensure the equation is in the form y=mx+b, where
m is the slope and b is the y-intercept.
Identify the slope (m) and y-intercept (b): From the equation, determine the values of m and b.
Plot the y-intercept: Locate the point (0,b) on the graph, which is where the line crosses the y-axis.
Use the slope (m) to find another point: The slope (m) represents how the line rises (or falls) for each unit increase in x. So, starting from the y-intercept, move m units up (if m is positive) or down (if m is negative), and
1 unit to the right (positive x), or left (negative x), to find another point.
Draw the line: Once you have at least two points, draw a straight line through them. This line represents the graph of the linear equation.
Label the axes and add a title (if needed): Don't forget to label the x-axis and y-axis with their respective variables (usually "x" and "y"), and give your graph a title if it's part of a larger document or presentation.
Here's an example:
Let's say you have the equation
y=2x+1:
The slope (m) is 2, and the y-intercept (b) is 1.
Plot the y-intercept (0,1).
Use the slope: Move 2 units up and 1 unit to the right from the y-interception point to get another point, say (1,3).
Connect the two points (0,1) and (1,3) with a straight line.
Label the axes and title the graph if necessary
This is how you graph a linear equation. Depending on the equation's slope and y-intercept, the line can have various slopes and positions on the coordinate plane.
Unit 4 Exercises 4.2:
Determine whether the given points are on the graph of y= 2x+3.
Select all points that lie on the graph.
(5,8)
(0,2)
(-5,-7)
(-2,-1)
To determine if the given points lie on the graph of y=2x+3, you need to check if the y-coordinate of each point matches the value you would get by plugging the x-coordinate into the equation.
The equation is y=2x+3.
Let's check each point:
Point (5, 8):
Plug in x=5 into the equation: y=2(5)+3=10+3=13.
The calculated value (13) does not match the y-coordinate (8) of this point. So, (5, 8) is not on the graph.
Point (0, 2):
Plug in x=0 into the equation: y=2(0)+3=0+3=3.
The calculated value (3) does not match the y-coordinate (2) of this point. So, (0, 2) is not on the graph.
Point (-5, -7):
Plug in x=−5 into the equation: y=2(−5)+3=−10+3=−7.
The calculated value (-7) matches the y-coordinate (-7) of this point. So, (-5, -7) is on the graph.
Point (-2, -1):
Plug in x=−2 into the equation: y=2(−2)+3=−4+3=−1.
The calculated value (-1) matches the y-coordinate (-1) of this point. So, (-2, -1) is on the graph.
So, the points (-5, -7) and (-2, -1) are on the graph of (y = 2x + 3), while the points (5, 8) and (0, 2) are not.
Sketch a graph of y= -x + 1

To sketch the graph of y=−x+1, you can follow these steps:
Identify the slope (m) and the y-intercept (b):
The slope (m) is -1. This tells you that for every one unit you move to the right (positive x-direction), you move down by one unit (negative y-direction).
The y-intercept (b) is 1. This is the point where the line crosses the y-axis, so the point (0, 1) is on the line.
Plot the y-intercept:
Start by plotting the point (0, 1) on your graph. This is where the line crosses the y-axis.
Use the slope to find another point:
Since the slope is -1, for every one unit you move to the right, you move down one unit. So, from the point (0, 1), move one unit to the right and one unit down to get another point, such as (1, 0).
Draw the line:
Now that you have two points, (0, 1) and (1, 0), you can draw a straight line through them. This line represents the graph of y=−x+1.
Extend the line:
You can extend the line in both directions to cover more of the coordinate plane if needed.
Sketch a graph of y= -1

The equation y=−1 represents a horizontal line at the y-coordinate of -1. In other words, the value of y is always -1, regardless of the value of x. This means the line is parallel to the x-axis and will pass through every point where y equals -1. The horizontal line is at y = -1, and it extends infinitely in both the positive and negative x-directions. The line is parallel to the x-axis, and the y-coordinate is always -1 along the entire length of the line.

Equation: $y=-5$
The equation y=−5 represents a horizontal line at the y-coordinate of -5. This line is parallel to the x-axis and passes through every point where y equals -5.The horizontal line is at y = -5 and extends infinitely in both the positive and negative x-directions. The y-coordinate is always -5 along the entire length of the line.

Write the equation of the line shown. Be sure to use the correct variable.
Equation: $x=9$
The equation x=9 represents a vertical line at the x-coordinate of 9. This line is parallel to the y-axis and passes through every point where x equals 9. The line goes on infinitely.
Sketch a graph of y= -x -2

To sketch the graph of y=−x−2, you can follow these steps:
Identify the slope (m) and the y-intercept (b):
The slope (m) is -1, which tells you that for every one unit you move to the right (positive x-direction), you move down one unit (negative y-direction).
The y-intercept (b) is -2. This is the point where the line crosses the y-axis, so the point (0, -2) is on the line.
Plot the y-intercept:
Start by plotting the point (0, -2) on your graph. This is where the line crosses the y-axis.
Use the slope to find another point:
Since the slope is -1, for every one unit you move to the right, you move down one unit. So, from the point (0, -2), move one unit to the right and one unit down to get another point, such as (1, -3).
Draw the line:
Now that you have two points, (0, -2) and (1, -3), you can draw a straight line through them. This line represents the graph of y=−x−2.
Extend the line:
You can extend the line in both directions to cover more of the coordinate plane if needed.
Last year, Pinwheel Industries introduced a new toy. It cost $
A.) Give a linear equation in the form
B.) The total cost to produce
C.) With $19250, a total of
A.) The linear equation that gives the total cost (C) to produce n toys is:
C=15n+3500
n represents the number of toys produced.
The constant term 3500 represents the initial development cost, and 15 represents the cost to manufacture each toy.
B.) To find the total cost to produce n=4850 toys, you can plug this value into the equation:
C=15⋅4850+3500
Calculate this to find the total cost:
C=72750+3500=76250
So, the total cost to produce 4850 toys is $76,250.
C.) To determine how many toys can be produced with $19,250, you can rearrange the equation to solve for n:
C=15n+3500
15n=C−3500
n= c-3500/15
Now, plug in the given budget of $19,250:
n = 19250−3500/15
Calculate this to find the number of toys that can be produced:
n=15750 / 15 =1050
So, with $19,250, a total of 1050 toys can be produced.

Write the equation of the line shown. Be sure to use the correct variable.
Equation: $x=2$
Equation: $x=2$
The equation x=2 represents a vertical line at the x-coordinate of 2. This line is parallel to the y-axis and passes through every point where x equals 2.
A town's population has been growing linearly. In 2003 the population was 63,000. The population has been growing by 1700 people each year.
Write an equation for the population, P, x
P = $1700x+63,000$
Use the formula to find the population in 2009: $73,200$

Use the graph to identify the

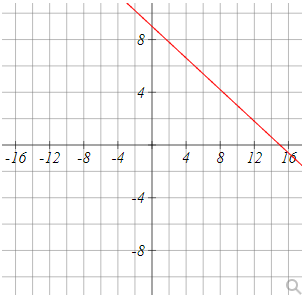


Make sure the y-intercept is written as a coordinate.
Slope = $-8$
y-intercept =(0,3)


Write an equation for the population, P, x
P = $1700x+63,000$
Use the formula to find the population in 2009: $73,200$
To write an equation for the population, P, x years after 2003, we can use the information provided:
In 2003, the population was 63,000.
The population has been growing by 1,700 people each year.
The equation for the population, P, x years after 2003 can be expressed as:
P=63,000+1,700x
Now, to find the population in 2009 (which is 6 years after 2003), we can substitute x=6 into the equation:
P=63,000+1,700*6
Calculate this to find the population in 2009:
P=63,000+10,200=73,200
So, the population in 2009 is 73,200 people.
A company makes pens. They sell each pen for $7.
Their revenue is represented by R = 7 x.
The cost to make the pens is $1 each with a one time start up cost of $4000.
Their cost is represented by C = 1 x + 4000.
a) Find the profit, P, (P = R - C) when the company sells 1000 pens.
-2000
-7000
2000
11000
7000
b) Find the number of pens they need to sell to break even (when R = C).
4000
572
667
800
To find the profit (P) when the company sells 1000 pens, you can use the formula for profit:
P=R−C
Where:
R is the revenue (which is 7x in this case).
C is the cost (which is 1x+4000 in this case).
Now, plug in the values:
R=7x (revenue per pen sold)
C=1x+4000 (cost per pen plus startup cost)
We want to find the profit when the company sells 1000 pens, so x=1000.
Now, calculate the profit:
P=(7x)−(1x+4000)
P=(7*1000)−(1*1000+4000)
P=7000−(1000+4000)
P=7000−5000
P=2000
So, the profit when the company sells 1000 pens is $2000.
To find the number of pens the company needs to sell to break even, you can set the revenue equal to the cost and solve for x:
R=C
Substitute the expressions for R and C:
7x= 1x +4000
Now, solve for x:
Subtract 1x from both sides:
7x-1x = 1x - 1x +4000
This simplifies to:
6x = 4000
Now divide both sides by 6 to isolate x:
6x/6 = 4000/6
x= 4000/6
x= 666.6
Since you can't sell a fraction of a pen, you would need to sell approximately 667 pens to break even.
Graphing using intercepts is a method to graph a linear equation by finding and plotting the x-intercept and y-intercept of the line. The x-intercept is the point where the line crosses the x-axis, and the y-intercept is the point where the line crosses the y-axis. Once you have these two points, you can draw the line that passes through them.
Here are the steps to graph a linear equation using intercepts:
Write the equation in slope-intercept form: Ensure the equation is in the form
y=mx+b, where m is the slope and b is the y-intercept.
Find the x-intercept:
To find the x-intercept, set y=0 in the equation and solve for x. This will give you the x-coordinate of the x-intercept.
The x-intercept is a point of the form (x,0).
Find the y-intercept:
To find the y-intercept, set x=0 in the equation and solve for y. This will give you the y-coordinate of the y-intercept.
The y-intercept is a point of the form (0,y).
Plot the x-intercept and y-intercept:
Plot the x-intercept and y-intercept as points on the graph.
Draw the line:
Once you have both intercepts plotted, draw a straight line passing through these points.
Extend the line:
Extend the line in both directions if necessary to cover the entire graph.
Unit 4 Exercises 4.3: Graphing Using Intercepts

Use the graph to identify the
For the first set of points: (x = 4, y = 0)
Plot the point (4, 0) on the graph. This point is located at x = 4 on the x-axis and y = 0 on the y-axis. It's on the right side of the origin.
For the second set of points: (x = 0, y = -4)
Plot the point (0, -4) on the graph. This point is located at x = 0 on the x-axis and y = -4 on the y-axis. It's below the origin.
Now, you have two points plotted on the graph: (4, 0) and (0, -4).
If you would like to connect these points to represent a line, you can draw a straight line passing through these two points. This line would be a horizontal line that extends from (4, 0) to (0, -4).

Use the graph to identify the x and y intercepts of the graph. Note the scale on each axis since they may not be the same.
x intercept = (,0)
You have provided the x-intercept and y-intercept of a linear equation. To graph this line, you can follow these steps:
Plot the x-intercept: The x-intercept is the point (-6, 0). Plot this point on the graph, which is located at x = -6 on the x-axis and y = 0 on the y-axis. This point is where the line crosses the x-axis.
Plot the y-intercept: The y-intercept is the point (0, 15). Plot this point on the graph, which is located at x = 0 on the x-axis and y = 15 on the y-axis. This point is where the line crosses the y-axis.
Connect the points: Draw a straight line that passes through both the x-intercept and y-intercept. This line represents the graph of the equation.

Use the graph to identify the x and y intercepts of the graph. Note the scale on each axis since they may not be the same.
x intercept = (,0)
To graph this line, follow these steps:
Plot the x-intercept: The x-intercept is the point (15, 0). Plot this point on the graph, which is located at x = 15 on the x-axis and y = 0 on the y-axis. This point is where the line crosses the x-axis.
Plot the y-intercept: The y-intercept is the point (0, 9). Plot this point on the graph, which is located at x = 0 on the x-axis and y = 9 on the y-axis. This point is where the line crosses the y-axis.
Connect the points: Draw a straight line that passes through both the x-intercept and y-intercept. This line represents the graph of the equation.
Cost, Revenue & Profit
For these problems,
The fixed costs for a certain item are $155 per week. The cost to produce each item is $8 per item.
Using this information, what is the cost equation? Give your answer in slope-intercept form:
The retailer intends to sell each item for $12/item.
Using this information, what is the revenue equation? Give your answer in slope-intercept form:
If in this week 36 items are made, and all items are sold in the week, what are the total costs to the retailer?
Cost = $
What is the revenue from selling 36 items?
Revenue = $
Finally, what is the profit for this retailer?
Profit = $
Box 1 & 2: Enter your answer as an expression. Example: 3x^2+1, x/5, (a+b)/c
Be sure your variables match those in the question.
Let's break down the problem step by step:
Cost Equation:
The cost equation represents the total cost (y) to produce x items. You mentioned that the fixed cost is $155 per week, and the cost to produce each item is $8.
Fixed Cost: $155
Cost per item: $8
To create the cost equation in slope-intercept form (y=mx+b), where m is the cost per item and b is the fixed cost, we can write it as:
y=8x+155
So, the cost equation is
y=8x+155.
Revenue Equation:
The revenue equation represents the total revenue (y) from selling x items. You mentioned that each item is sold for $12/item.
Revenue per item: $12
To create the revenue equation in slope-intercept form, we can write it as:
y=12x
So, the revenue equation is
y=12x.
Total Costs to the Retailer:
If 36 items are made and all items are sold in the week, we can find the total costs to the retailer using the cost equation:
y=8x+155
Substituting
x=36:
y=8(36)+155
Calculate the total cost:
y=288+155
y=443
So, the total costs to the retailer are $443.
Revenue from Selling 36 Items:
To find the revenue from selling 36 items, we can use the revenue equation:
y=12x
Substituting x=36:
y=12(36)
Calculate the revenue:
y=432
So, the revenue from selling 36 items is $432.
Profit for the Retailer:
To calculate the profit, you can subtract the total costs from the total revenue:
Profit = Revenue - Total Costs
Substituting the values we found:
Profit = $432 - $443
Profit = -$11
So, the profit for this retailer is -$11, which means they incurred a loss of $11.
Suppose you were given $1000 from your uncle. You deposited that money in a bank and added $75 per month.
Write an equation to model how much money you have deposited after
$s=1000+75m$
What 1-variable equation would you solve to figure out how many months it would take to save $10,000 dollars?
$m=\frac{9000}{75}$
How many months would it take to save $10,000?
$120$
Equation for Deposited Money:
To model how much money you have deposited after m months, you start with the initial amount of $1000 from your uncle and add $75 each month. This can be represented as:
s=1000+75m
In this equation:
s represents the total amount you have deposited after m months.
$1000 is the initial deposit.
$75m represents the money you add each month.
Equation for Saving $10,000:
To figure out how many months it would take to save $10,000, you can set up a 1-variable equation where m represents the number of months:
1000+75m=10000
Now, isolate m by subtracting 1000 from both sides:
75m=10000−1000
75m=9000
Finally, divide both sides by 75 to find m:
m= 75/9000 =120
Slope and rate of change are related concepts in mathematics, particularly in the context of linear equations and graphs. Let's explore what each term means:
Slope:
Slope is a measure of the steepness or incline of a line on a graph.
It quantifies how much the dependent variable (usually denoted as y)changes in response to a change in the independent variable (usually denoted as x).
The formula for calculating the slope (m) between two points (x1,y1) and (x2,y2) on a line is:
m= y2-y1/x2-x1
A positive slope indicates that as x increases, y also increases (the line slants upward to the right).
A negative slope indicates that as x increases, y decreases (the line slants downward to the right).
A slope of zero means that y does not change as x changes(the line is horizontal).
A vertical line has an undefined slope because the change in x is zero.
Rate of Change:
Rate of change is a general concept that measures how one quantity changes with respect to another quantity. It is not limited to linear relationships but can apply to various scenarios.
In the context of linear equations and graphs, the rate of change often refers to the slope.
For example, if you have a linear equation y = mx + b, where m is the slope, m represents the rate of change of y with respect to x. It tells you how much y changes for each unit change in x. In summary, slope is a specific concept related to the steepness of a line, while rate of change is a broader concept that can apply to various situations, including linear relationships where it often corresponds to the slope. The slope represents the rate of change of one variable concerning another in a linear relationship.
Unit 4 Exercises 4.4: Slope and Rate of Change

Slope = m = 2/5
This tells us the rate of change in a linear relationship. Specifically, it means that for every unit increase in the independent variable (usually x), the dependent variable (usually y) increases by 2/5 of a unit.

Find the slope of the line.
Slope = m = -4/3
Slope = m = -4/3
This means that in a linear relationship, for every unit increase in the independent variable (usually x), the dependent variable (usually y) decreases by 4/3 of a unit.

Find the slope of the line.
Slope = m=
Enter your answer as an integer or as a reduced fraction in the form A/B.
Slope = m=
Enter your answer as an integer or as a reduced fraction in the form A/B.
This means that in a linear relationship, for every unit increase in the independent variable (usually x), the dependent variable (usually y) decreases by one unit.

Find the slope of the line.
Slope = m=
Enter your answer as an integer or as a reduced fraction in the form A/B.
Slope = m=
Enter your answer as an integer or as a reduced fraction in the form A/B.
This means that in a linear relationship, for every unit increase in the independent variable (usually x), the dependent variable (usually y) decreases by two units.
A company discovers that to produce x=790 new electronic parts, it will cost y =$69380. To produce 510 new electronic parts, it will cost $46420.
Compute the slope of the costs and choose the most accurate statement from the following:
Costs are decreasing at a rate of $82 per item.
Costs are decreasing at a rate of $88 per item.
Costs are decreasing at a rate of $87 per item.
Costs are increasing at a rate of $87 per item.
Costs are increasing at a rate of $82 per item.
Costs are increasing at a rate of $88 per item.
To compute the slope(m) when costs are increasing by $82 per item, we can use the formula for slope (m) with two points (x1,y1) and (x2,y2) on a line:
m = y2-y1 / x2-x1
in your case, you have two sets of points:
point1:x1 = 790, y1 =69380
point2:x2 = 510, y2 =46420
Now, plug these values into the formula, keeping in mind that costs are increasing by $82 per item:
m = 69380-46420/790-510
Calculate the slope:
m = 22960/280
Simplify:
m=82
So, when interpreted correctly as costs increasing by $82 per item, the slope of the costs is indeed $82 per item.
A city's population in the year x =1950 was y=2,269,500. In 1959 the population was 2,267,700.
Compute the slope of the population growth (or decline) and choose the most accurate statement from the following:
The population is decreasing at a rate of 250 people per year.
The population is increasing at a rate of 300 people per year.
The population is decreasing at a rate of 300 people per year.
The population is increasing at a rate of 250 people per year.
The population is increasing at a rate of 200 people per year.
The population is decreasing at a rate of 200 people per year.
To compute the slope of population growth (or decline), we can use the formula for slope (m) with two points (x1,y1) and (x2,y2) on a line:
m = y2-y1 / x2-x1
in your case, you have two sets of points:
Point1: x1 =1950, y1 =2,269,500
point2: x2 =1959, y2 =2,267,700
Now, plug these values into the formula:
m= 2,267,700-2,269,500/1959-1950
Calculate the slope:
m= -1800/9
Simplify
m=-200
So, the slope of the population growth (or decline) is -200 people per year.
Superman needs to save Lois from the clutches of Lex Luthor. After flying for 8 seconds, he is 1636 meters from her. Then at 14 seconds he is 1288 meters from her.
What is Superman's average rate? $58$ meters per second
How far does Superman fly every 8 seconds? $464$ meters
How close to Lois is Superman after 22 seconds? 824 meters
What is Superman's average rate? $58$ meters per second
How far does Superman fly every 8 seconds? $464$ meters
How close to Lois is Superman after 22 seconds? 824 meters
If you drive 180 miles and use 12 gallons of gas, what is your rate?
Distance traveled (miles) = 180 miles
Gas used (gallons) = 12 gallons
Plug these values into the formula:
rate (miles per gallon) = 180 miles/12 gallons =15/1 miles per gallon So, your rate is 15 miles per gallon. This means you can travel 15 miles for every 1 gallon of gas consumed.
Graphs Using Slope-Intercept Form:
Graphing linear equations using the slope-intercept form (y=mx+b) is a straightforward process. This form is particularly convenient for graphing because it directly provides the slope (m) and y-intercept (b) of the line. Here are the steps to graph a linear equation in slope-intercept form:
Identify the slope (m) and y-intercept (b) from the equation.
The slope (m) is the coefficient of x.
The y-intercept (b) is the constant term.
Plot the y-intercept (b) on the y-axis.
Use the slope (m) to find a second point on the line. The slope tells you how to move from the y-intercept to another point. If the slope is positive, move up and to the right; if it's negative, move down and to the right.
Draw a straight line through the two points you've plotted. This line represents the graph of the linear equation.
Here's a step-by-step example:
Let's say you have the equation y=2x+3.
Identify the slope (m) and y-intercept (b):
m=2 (slope)
b=3 (y-intercept)
Plot the y-intercept (b): This means you should put a point at (0, 3) on the graph.
Use the slope (m=2) to find another point. Starting from the y-intercept, move up 2 units and to the right 1 unit. This gives you another point, so plot (1, 5).
Draw a straight line through the two points (0, 3) and (1, 5).
Your graph should look like a straight line that passes through those two points, and it represents the equation y=2x+3.
Remember that the slope (m) determines the steepness of the line. A larger absolute value of m results in a steeper line, while a smaller absolute value of m results in a shallower line. If m is negative, the line slopes downward from left to right, and if m is positive, it slopes upward from left to right.
Graphing linear equations in slope-intercept form is a fundamental skill in algebra and provides a visual representation of the relationship between two variables.
Unit 4 Exercises 4.5:
Give the slope and the y-intercept of the line
Make sure the y-intercept is written as a coordinate.
Slope = $4$
y-intercept = $\left(0,-3\right)$
Make sure the y-intercept is written as a coordinate.
Slope = $4$
y-intercept = $\left(0,-3\right)$
Hint: Did you write the y-intercept as an ordered pair, including the parentheses? e.g. (0,b)
The equation y=4x−3 is in slope-intercept form, y=mx+b, where:
The slope (m) is the coefficient of x, which is 4.
The y-intercept (b) is the constant term, which is −3.
So, the slope is 4, and the y-intercept is (0,−3) (written as an ordered pair, including parentheses).
You started this year with $350 saved and you continue to save $22 per month.
Write an equation to model this situation (use m
Write an equation to model this situation (use m
To model the situation where you start with $350 saved and continue to save $22 per month for m months, you can use the equation for savings as a function of the number of months (m)
The proper way to write the equation is :
S=22m+350
Where:
S represents the total savings after m months.
350 represents the initial savings you started with.
22 represents the amount you save per month.
m represents the number of months.
Which of the following is a graph of y= 0.5x +2

To graph y=0.5x+2, you can follow these steps:
Identify the slope and the y-intercept from the equation:
The slope (m) is 0.5.
The y-intercept (b) 2.
Plot the y-intercept (b) on the graph. In this case, it's at the point (0, 2).
Use the slope (m) to find another point on the line. Since the slope is 0.5, you can interpret this as "rise over run." So, from the y-intercept (0, 2), you can go up 1 unit and then move right 2 units. This gives you another point at (2, 3).
Connect the two points (0, 2) and (2, 3) with a straight line. This line represents the graph of y=0.5x+2.
Your graph should be a straight line that rises at a rate of 0.5 (meaning it goes up 0.5 units for every 1 unit to the right) and passes through the point (0, 2).
Sketch a graph of the equation y = 3/2x

To sketch the graph of the equation y= 2/3x, you can follow these steps:
Identify the slope (m): In this equation, the slope (m) is 3/2.
Plot the y-intercept: Since there's no constant term (i.e., the equation doesn't have a "+ b" term), the y-intercept is at the origin, which is the point (0, 0).
Use the slope to find another point on the line: The slope 3/2 means that for every 1 unit you move to the right along the x-axis, you need to move up 3/2 units on the y-axis. Starting from the origin (0, 0), you can go up 3 units and to the right 2 units to get another point. So, plot the point (2, 3).
Connect the two points (0, 0) and (2, 3) with a straight line.
Your graph should look like a straight line that passes through the origin (0, 0) and the point (2, 3). This line has a positive slope (m= 3/2) and rises as you move from left to right.
Sketch a graph of y = 2x-1

To sketch the graph of the equation y=2x−1, follow these steps:
Identify the slope (m) and the y-intercept (b) from the equation:
The slope (m) is 2.
The y-intercept (b) is −1.
Plot the y-intercept: The y-intercept is at the point (0, -1).
Use the slope to find another point on the line: Since the slope is 2, for every 1 unit you move to the right along the x-axis, you need to move up 2 units on the y-axis. Starting from the y-intercept (0, -1), go up 2 units and to the right 1 unit to find another point. So, plot the point (1, 1).
Connect the two points (0, -1) and (1, 1) with a straight line.
Your graph should look like a straight line that passes through the points (0, -1) and (1, 1). This line has a positive slope (m=2) and rises as you move from left to right.
Sketch a graph of y= -x+2

To sketch the graph of the equation y=−x+2, you can follow these steps:
Identify the slope (m) and the y-intercept (b) from the equation:
The slope (m) is −1.
The y-intercept (b) is 2.
Plot the y-intercept: The y-intercept is at the point (0, 2).
Use the slope to find another point on the line: Since the slope is −1, for every 1 unit you move to the right along the x-axis, you need to move down 1 unit on the y-axis. Starting from the y-intercept (0, 2), go down 1 unit and to the right 1 unit to find another point. So, plot the point (1, 1).
Connect the two points (0, 2) and (1, 1) with a straight line.
Your graph should look like a straight line that passes through the points (0, 2) and (1, 1). This line has a negative slope (m=−1) and slopes downward as you move from left to right.
Sketch a graph of y= 1/2x-2

To sketch the graph of the equation y=1/2x-2, you can follow these steps:
Identify the slope (m) and the y-intercept (b) from the equation:
The slope (m) is 1/2.
The y-intercept (b) is −2.
Plot the y-intercept: The y-intercept is at the point (0, -2).
Use the slope to find another point on the line: Since the slope is 1/2, for every 1 unit you move to the right along the x-axis, you need to move up 1/2 unit on the y-axis. Starting from the y-intercept (0, -2), go up 1/2 unit and to the right 1 unit to find another point. So, plot the point (1, -1.5).
Connect the two points (0, -2) and (1, -1.5) with a straight line.
Your graph should look like a straight line that passes through the points (0, -2) and (1, -1.5). This line has a positive slope (m= 1/2) and rises as you move from left to right.
After visiting the Titanic, Captain Brain and Mr. Pinky are taking the Alvin submarine back to the surface of the water. They start 1900 meters below the surface of the water, and ascend at 53 meters per hour.
Note: under the water is a negative number.
Write an equation to model this situation (use
Note: under the water is a negative number.
Write an equation to model this situation (use
To model the situation of Captain Brain and Mr. Pinky ascending in the Alvin submarine from 1900 meters below the surface at a rate of 53 meters per hour, you can use the following equation:
m(h)=−1900+53h
Where:
m(h) represents the depth below the surface (in meters) at a given number of hours (h).
−1900 represents the initial depth of 1900 meters below the surface.
53h represents the amount the depth changes as they ascend at a rate of 53 meters per hour.
Graphing linear equations involves plotting points on a coordinate plane and connecting those points to create a straight line. Here are the general steps to graph a linear equation:
Understand the Equation: Make sure the equation is in slope-intercept form, which is y =mx +b, where:
m is the slope (rate of change).
bis the y-intercept (the point where the line crosses the y-axis).
Identify the Slope and Y-Intercept: From the equation, determine the values of m and b. These values are crucial for plotting the line.
Plot the Y-Intercept: Start by plotting the y-intercept (0,b)on the coordinate plane. This point is where the line crosses the y-axis.
Use the Slope: Use the slope m to find another point on the line. The slope represents the rate of change, which tells you how much y changes for every unit change in x.
If the slope is a fraction a/b, you can go up a units and right b units from y-intercept to find the next point. This gives you a second point on the line.
If the slope is a whole number, you can go up that many units and right 1 unit from the y-intercept to find the next point.
Plot Additional Points: Continue using the slope to find more points on the line, and plot them on the coordinate plane.
Connect the Points: Once you have several points plotted, use a straight edge or ruler to draw a line that passes through all the points. This line represents the graph of the linear equation.
Label the Axes: Don't forget to label the x-axis and y-axis with appropriate scales.
Here's an example:
Consider the equation y = 2x +3.
The slope(m) is 2.
The y-intercept (b) is 3.
Plotting this equation:
Start by plotting the y-intercept, which is (0, 3).
Use the slope of 2 to find another point: Go up 2 units and right 1 unit from the y-intercept to get (1, 5).
Plot additional points using the same slope, and then connect them with a straight line.
This process creates the graph of the linear equation y = 2x +3.
Unit 4 Graphing Linear Equations:
In which quadrant does the point (3,2) lie?
I
III
IV
II
The point (3, 2) lies in the first quadrant on the Cartesian coordinate plane. In the first quadrant, both the x-coordinate (3 in this case) and the y-coordinate (2 in this case) are positive. This means that the point is to the right of the origin (x-axis) and above the origin (y-axis).
Find the coordinates of the point plotted below

The point (2, 4) can be plotted on the Cartesian coordinate plane as follows:
The x-coordinate (2) represents how far to the right you should move from the origin.
The y-coordinate (4) represents how far upward you should move from the origin.
So, starting from the origin (0, 0), move 2 units to the right along the x-axis and then 4 units upward along the y-axis. You will arrive at the point (2, 4).
Plot the points (0,-2), (-3,0), (1,1), (4,-4)

Determine whether the given points are on the graph of y= 2x+3
(3,8)
(4,6)
(0,3)
(-3,-3)
To determine whether the given points are on the graph of y=2x+3, you can substitute the x-values from each point into the equation and check if the resulting y-values match. If they match, the point lies on the graph; if not, it does not.
For the point (3, 8):
Substitute
x=3 into the equation:
y=2(3)+3=6+3=9.
The calculated y-value (9) does not match the given y-value (8), so (3, 8) is not on the graph.
For the point (4, 6):
Substitute x=4 into the equation:
y=2(4)+3=8+3=11.
The calculated y-value (11) does not match the given y-value (6), so (4, 6) is not on the graph.
For the point (0, 3):
Substitute x=0 into the equation:
y=2(0)+3=0+3=3.
The calculated y-value (3) matches the given y-value (3), so (0, 3) is on the graph.
For the point (-3, -3):
Substitute x=−3 into the equation:
y=2(−3)+3=−6+3=−3.
The calculated y-value (-3) matches the given y-value (-3), so (-3, -3) is on the graph.
So, (0, 3) and (-3, -3) are on the graph of y=2x+3, while (3, 8) and (4, 6) are not.
Sketch a graph of y = 2x +2

To sketch the graph of the equation y=2x+2, you can follow these steps:
Identify the slope (m) and the y-intercept (b) from the equation:
The slope (m) is 2.
The y-intercept (b) is 2.
Plot the y-intercept: The y-intercept is at the point (0, 2).
Use the slope to find another point on the line: Since the slope is 2, for every 1 unit you move to the right along the x-axis, you need to move up 2 units on the y-axis. Starting from the y-intercept (0, 2), go up 2 units and to the right 1 unit to find another point. So, plot the point (1, 4).
Connect the two points (0, 2) and (1, 4) with a straight line.
Your graph should look like a straight line that passes through the points (0, 2) and (1, 4). This line has a positive slope (m=2) and rises as you move from left to right.
Sketch a graph of y = 2x -1

To sketch the graph of the equation y=2x−1, you can follow these steps:
Identify the slope (m) and the y-intercept (b) from the equation:
The slope (m) is 2.
The y-intercept (b) is −1.
Plot the y-intercept: The y-intercept is at the point (0, -1).
Use the slope to find another point on the line: Since the slope is 2, for every 1 unit you move to the right along the x-axis, you need to move up 2 units on the y-axis. Starting from the y-intercept (0, -1), go up 2 units and to the right 1 unit to find another point. So, plot the point (1, 1).
Connect the two points (0, -1) and (1, 1) with a straight line.
Your graph should look like a straight line that passes through the points (0, -1) and (1, 1). This line has a positive slope (m=2) and rises as you move from left to right.
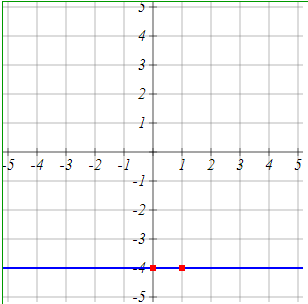
Sketch a graph of y= -4

The equation y=−4 represents a horizontal line that is parallel to the x-axis and passes through the y-coordinate of -4. Since it is a horizontal line, the value of y remains the same regardless of the value of x.
To sketch the graph of y=−4, you can simply draw a straight horizontal line at y=−4 on the Cartesian coordinate plane.

Write the equation of the line shown. Be sure to use the correct variable.
Equation: $y=6$
Equation: $y=6$
The equation y=6 represents a horizontal line that is parallel to the x-axis and passes through the y-coordinate of 6. Similar to the previous example, since it's a horizontal line, the value of y remains constant regardless of the value of x.
To sketch the graph of y=6, you can draw a straight horizontal line at y=6 on the Cartesian coordinate plane.
A company makes pens. They sell each pen for $7.
Their revenue is represented by R = 7 x.
The cost to make the pens is $2 each with a one time start up cost of $6000.
Their cost is represented by C = 2 x + 6000.
a) Find the profit, P, (P = R - C) when the company sells 1000 pens.
13000
-7000
1000
7000
-1000
Find the number of pens they need to sell to break even (when R = C).
858
3000
2000
1200
To find the profit (P) when the company sells 1000 pens, you can use the profit formula:
Where:
- is the revenue.
- is the cost.
You've already defined the revenue and cost functions as:
(where is the number of pens sold) (where is the number of pens sold)
Now, substitute into both equations to find the revenue and cost when the company sells 1000 pens:
Now, calculate the profit:
So, when the company sells 1000 pens, their profit is -$1000.
To find the number of pens the company needs to sell to break even (when revenue equals cost ), you can set the revenue and cost equations equal to each other and solve for :
Subtract from both sides of the equation:
Simplify:
Now, divide both sides by 5 to isolate :
So, the company needs to sell 1200 pens to break even.

Use the graph to identify the x
These points represent coordinates on the Cartesian coordinate plane.The point (8, 0) is located 8 units to the right of the origin (0,0) on the x-axis.The point (0, -8) is located 8 units below the origin (0,0) on the y-axis.
Suppose you were given $600 from your uncle. You deposited that money in a bank and added $20 per month.
Write an equation to model how much money you have deposited after
$s=600+20m$
What 1-variable equation would you solve to figure out how many months it would take to save $10,000 dollars?
$20m=10000-600$
How many months would it take to save $10,000?
$470$
To model how much money you have deposited after m months when you initially received $600 from your uncle and added $20 per month, you can use the following equation:
D(m)=600+20m
Where:
D(m) represents the amount you have deposited after m months.
600 represents the initial amount you received from your uncle.
20m represents the additional amount you deposit each month.
To figure out how many months it would take to save $10,000, you can set up the equation:
D(m)=10,000
Substitute the equation for D(m):
600+20m=10,000
Now, solve for m:
20m=10,000−600
20m=9,400
Divide both sides by 20:
m=9,400/20
m=470
So, it would take 470 months to save $10,000 by depositing $600 initially and adding $20 per month to your savings.

Find the slope of the line.
Slope =
Enter your answer as an integer or as a reduced fraction in the form A/B
The slope () is a crucial parameter in linear equations and represents the rate of change or the steepness of a line. In this case, means that for every 1 unit you move to the right along the x-axis, you should move up units on the y-axis.
A city's population in the year x=1982 was y=2,196,400. In 1965 the population was 2,200,650.
Compute the slope of the population growth (or decline) and choose the most accurate statement from the following:
The population is increasing at a rate of 200 people per year.
The population is decreasing at a rate of 250 people per year.
The population is decreasing at a rate of 200 people per year.
The population is decreasing at a rate of 100 people per year.
The population is increasing at a rate of 250 people per year.
The population is increasing at a rate of 100 people per year.
To compute the slope of the population growth or decline, we can use the formula for the slope () given two points and on a line:
In this case, the two points are and . Plugging in these values:
Simplifying:
So, the slope of the population change is . This means that the population is decreasing at a rate of 250 people per year.
Therefore, the most accurate statement is: "The population is decreasing at a rate of 250 people per year."
To calculate your rate (speed) when you drive 133 miles and use 7 gallons of gas, you can use the formula:
Rate (Speed) = Distance / Time
In this case, you've provided the distance (133 miles) and the amount of gas used (7 gallons). To find your rate, you need to know the time it took to cover that distance. If you have the time, you can use the formula to calculate the rate. For example, if you drove the 133 miles in 2 hours, you can calculate the rate as follows:
Rate (Speed) = Distance / Time Rate = 133 miles / 2 hours = 66.5 miles per hour
So, your rate would be 66.5 miles per hour in this example. If you have a different amount of time, you would adjust the calculation accordingly.
Give the slope and the y-intercept of the line y= -8x - 3
Make sure the y-intercept is written as a coordinate.
Slope = $-8$
y-intercept =(0,3)
he equation is in slope-intercept form, , where:
- The slope () is the coefficient of , which is .
- The y-intercept () is the constant term, which is .
So, the slope is , and the y-intercept is (written as an ordered pair, including parentheses).
To calculate your rate (speed) when you drive for 9 hours and travel 675 miles, you can use the formula:
Rate (Speed) = Distance / Time
In this case, you've driven for 9 hours (time) and covered a distance of 675 miles. Plug these values into the formula:
Rate = 675 miles / 9 hours = 75 miles per hour
So, your rate is 75 miles per hour.
Sketch a graph of the equation y= -2x

The phone company A Fee and Fee has a monthly cellular plan where a customer pays a flat monthly fee and then a certain amount of money per minute used on the phone. If a customer uses 210 minutes, the monthly cost will be $95.5. If the customer uses 880 minutes, the monthly cost will be $330.
A) Find an equation in the form
Answer:
B) Use your equation to find the total monthly cost if 976 minutes are used.
Answer: If 976 minutes are used, the total cost will be dollars.
A) Find an equation in the form
Answer:
B) Use your equation to find the total monthly cost if 976 minutes are used.
Answer: If 976 minutes are used, the total cost will be dollars.
A) To find an equation in the form , where is the number of monthly minutes used and is the total monthly cost of the A Fee and Fee plan, we can use the information provided. We have two points: (210 minutes, $95.5) and (880 minutes, $330).
Let's use the point-slope formula to find the equation:
First, find the slope () using the two points:
Now that we have the slope (), we can use one of the points and the slope to find the y-intercept (). We'll use the point (210 minutes, $95.5):
So, the equation in the form for the A Fee and Fee plan is:
B) To find the total monthly cost if 976 minutes are used, you can plug into the equation:
If 976 minutes are used, the total monthly cost will be approximately $363.60.
Project 4 Tasty Fruit Graph
Use
the graph below to answer the following questions.
Write all responses in full sentences.

1) In a full sentence, explain what the vertical axis represents. Vertical Axis represents the taste of fruits listed from not tasty to tasty.
2) In a full sentence, explain what the horizontal axis represents. Horizontal Axis represents how easy it is to eat fruits from difficult to easy.
3) Does the author think seedless and seeded grapes taste the same? Explain how you decided this. Can you tell if the author likes the taste of grape seeds? Yes, the author is rating seeded grapes and seedless on the same level of the horizontal level. The difference is only in how easy seedless is compared to the seeded in eating. But we can’t tell if the author likes the taste of grape seeds. But the author likes seeded grapes somewhat more than seedless grapes.
4) Which fruit does the author think is the best? Explain how you decided this. The best fruit has to be easy to eat and tasty and based on that peaches would be considered the best.
5)
Which fruit does the author think is
the worst? Explain how you decided this.
The worst fruit would be grapefruit according to the chart because it’s not
tasty and it’s also difficult to eat.
6) Overall, does the author think fruit in general is tasty or not tasty? Explain how you decided this. When we look at the chart 11 of the fruits are placed in the top two quadrants which is 11 out of 18 fruits are labeled as tasty. Because of that we can say the author likes most of the fruit listed so he thinks fruit is generally tasty. · -
7) Does the author think red and green apples are equally tasty? Explain how you decide this. Looking at the graph and how close both green and red apples are we can say the author thinks both are equally tasty. But since red are placed a little lower than green that the author likes green apples a little more than red ones.
8) Give two fruits that the author thinks have the same tasty value, but different ease of eating values. Explain what you are looking for graphically. Looking at Blueberries they are [easy] to eat and tasty and comparing them to pineapple which is [difficult] to eat but has the same level of being tasty. Bananas are [easy] to eat and Pomegranates are considered [difficult] to eat but they both are equally not tasty Green apples are [easy] to eat and watermelon is [difficult] to eat but both are equally tasty. What we look for is that the fruit is located the same distance on a vertical x axis but that they are the far from each other on a horizontal distance.
9) Give two fruits that the author thinks have the same ease of eating value, but different
tasty values. Explain what you are looking for
graphically. We can look at lemons [not tasty] and watermelon [tasty]
but both are equally difficult to eat. Another example is seeded grapes which
are [tasty] and bananas [not tasty] but both equally easy to eat. With both of
these cases we are looking for the fruits to both be almost the same distance
horizontally from the y axis on one side but they are the farthest from each
other vertically.
10) Which fruit does the author
have the strongest opinions about? Explain
how you decided this. The other has strong opinions of
Peaches most [tasty] and [easy] to eat and grapefruit most [not tasty] and
difficult to eat of the fruits. Pineapple can also be considered the most
difficult to eat as well. But we are looking at how the farthest fruits are
from the origin of the two axis.
11) Which fruit does the author have the mildest opinions
about? Explain how you decided this. It looks like it’s the
watermelon and bananas. We are looking at how close the fruits are to the
origin of the both the axis’s.
12) According to the author, do any of the fruits
have the same tasty-value as easy-value?
Explain what you are looking for graphically. Yes, these
fruits are watermelon, bananas, peaches and grapefruit. We are looking for
fruit that have the same x coordinate as the y coordinate. If we drew two
diagonals’ at a 45-degree angel at the origin, then fruit’s that fall on that
axis are as [tasty] as they are [easy] to eat.
13)
Does the author think taste or ease is more important? Explain
how you decide
this. The author favors how [easy] it is to eat over the taste of the
fruit. 11 out of the 18 fruits are considered to be [tasty] out of which 9 out
of 11 of the fruits are labeled as [easy]. 7 out of the 18 fruits that are
labeled [not tasty] of which 3 out of 7 fruits are labeled [easy] to eat. Also
12 out of 18 are labeled [easy] and 9 are labeled as being [tasty] 6 out of 18
are labeled [difficult] to eat and 2 are labeled as [tasty]. So it seems that
the author cares more about how easy it is to eat over how the fruit tastes.
Comments
Post a Comment